Timeline charts six months of Iran conflict and oil market swings
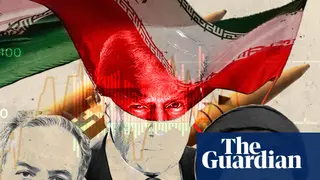
A new interactive timeline documents the Iran war from February 2026, showing how US-Israeli strikes, the death of Iran's supreme leader, and the closure of the Strait of Hormuz led to a regional conflict with global economic effects. It tracks attacks, shipping disruptions, and oil price changes using data from social media and shipping intelligence. The timeline highlights repeated ceasefires and failed negotiations that kept the strait at the center of the crisis.
The timeline draws on roughly 4,000 Truth Social posts, 7,700 IRGC Telegram messages, and selected X posts beginning February 28, 2026. Shipping transit data from Lloyd's List Intelligence tracks cargo vessels over 10,000 deadweight tonnage, including dark transits after the conflict began. Airstrike data from Acled covers explosions and remote violence events by Iranian, US, and Israeli forces, excluding interceptions.
In normal conditions, over 100 vessels transit the strait daily, carrying roughly a quarter of global seaborne oil trade. The timeline shows how each ceasefire and negotiation round was followed by fresh threats and renewed attacks, keeping the waterway at the crisis center. Oil price data from LSEG documents the market swings throughout the six-month period.
This conflict could affect global energy consumers through sustained oil price volatility